29 Results
View results:
Sort by:
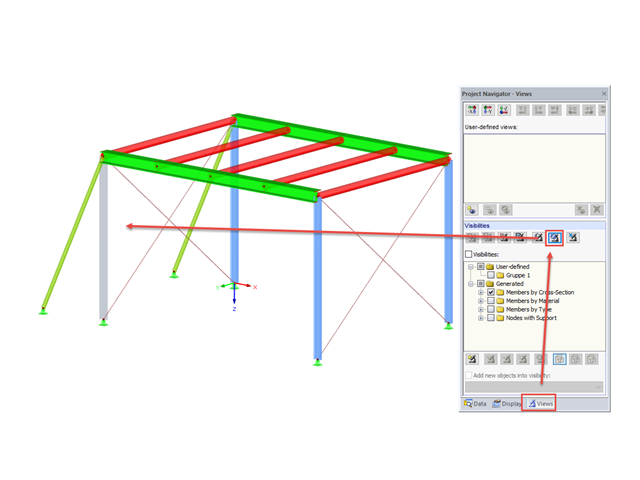
In RFEM and RSTAB, you can apply various visibilities in the Views project navigator.
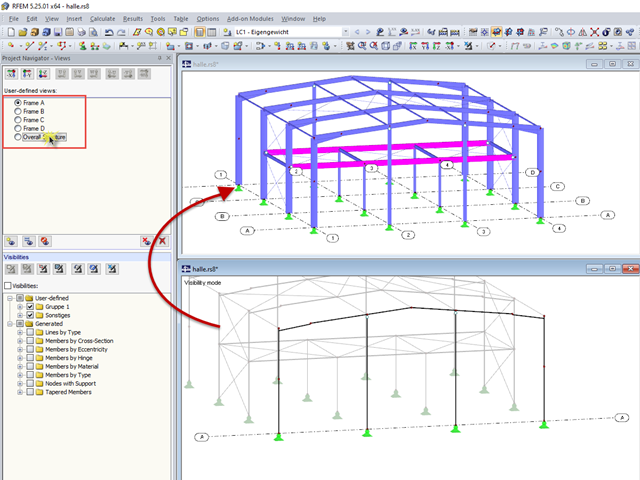
RFEM and RSTAB offer many display options in the Display Navigator. They can be completely different, depending on their function. You often have to click several times to make certain changes. If you want to optimize your work, you can create user‑defined views. In these views, you can save all specified settings. The following example illustrates this principle.
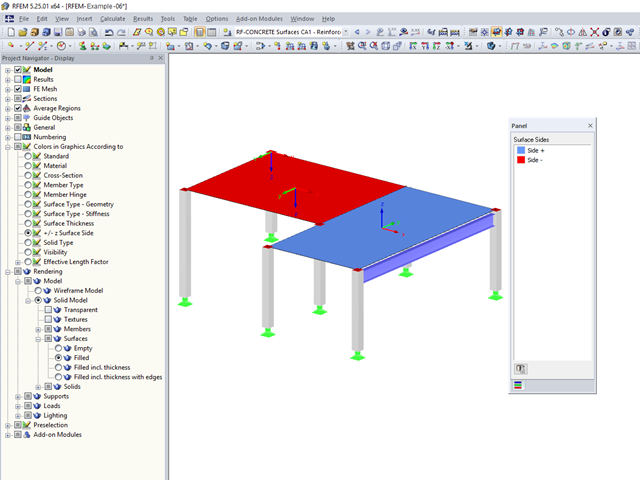
You can color the surfaces in the direction of the local z‑axis using the indicated option in the Display Navigator. By default, the side lying in the negative z-direction is colored red and the side lying in the positive z-direction is colored blue.
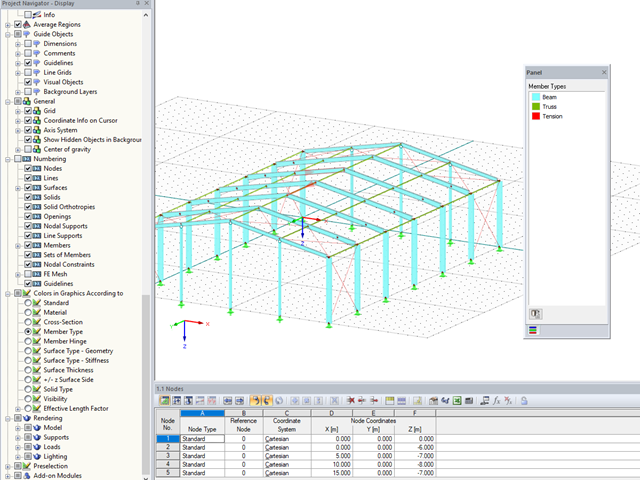
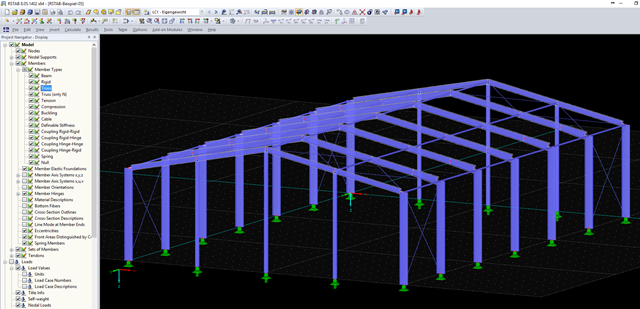
In RFEM and RSTAB, you can now also display and check the types of members used visually, by means of colors. To do this, an option has been integrated into the Display Navigator.
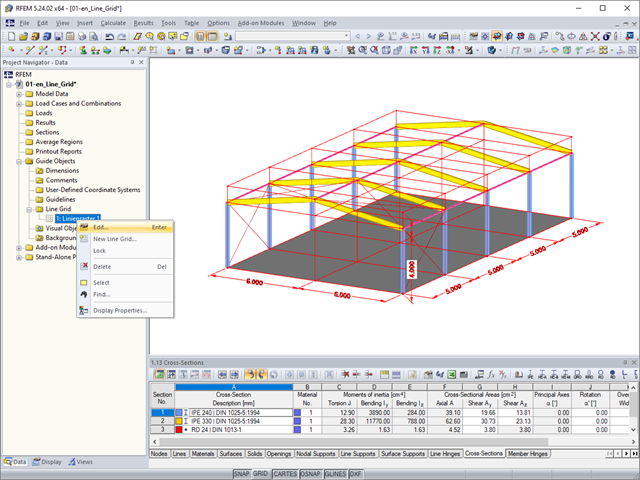
As a quick tool for changing the structure geometry, the "Line Grid" option is available in "Project Navigator – Data" under "Guide Objects".
The Views Navigator in RFEM 5 and RSTAB 8 provides many options for setting the screen views.
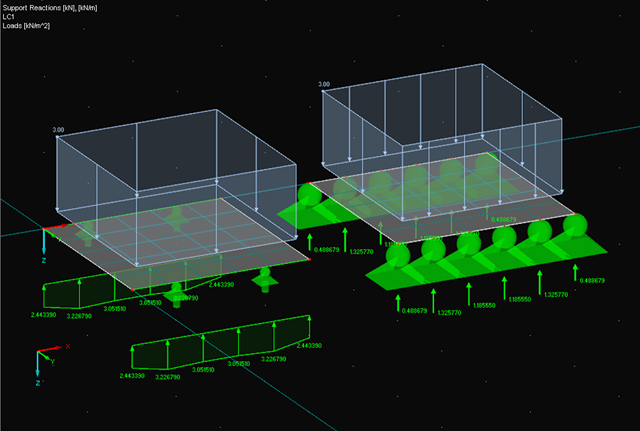
When evaluating line support forces, implausible diagrams sometimes arise at first glance. In particular, for variable loads at locations that also have a nodal support, at division points and edge locations of supported lines, the results sometimes show unexpected support reactions. Using the function of the linear smooth distribution in Project Navigator – Display does not always lead to the expected result diagram.
The efficient design of prestressed structural components requires a few additional steps that go beyond the standard reinforced concrete design, from modeling tendons to the calculation of equivalent loads to the cross-section resistance design. Therefore, it is important that the software for prestressed concrete design is structured and the navigation is possible in the program. RFEM with two add-on modules RF-TENDON and RF-TENDON Design fulfills these requirements and allows engineers to carry out the complete design of prestressed beams, frames, plates, buildings and bridges according to EN 1992-1-1 with National Annexes and SIA 262.
RFEM and RSTAB provide a wide range of selection options. Some of the previous posts have already described selection using "Special Selection" or tables.
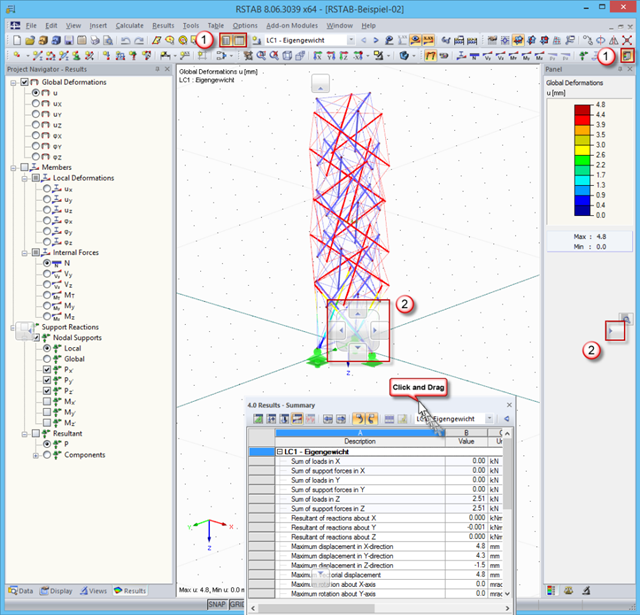
In order to use the working window area optimally for the graphical input of model data or for result evaluation, there are various options for arranging Project Navigator, the table, and the result panel.
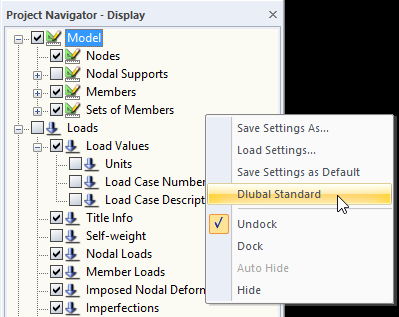
When you receive an RFEM or RSTAB file for further processing, the structures will be displayed in the program using the display settings of the last editor. If the settings do not correspond to your requirements, you can simply right‑click the empty area in Project Navigator - Display and select "Dlubal Standard". This returns the settings to the default values.
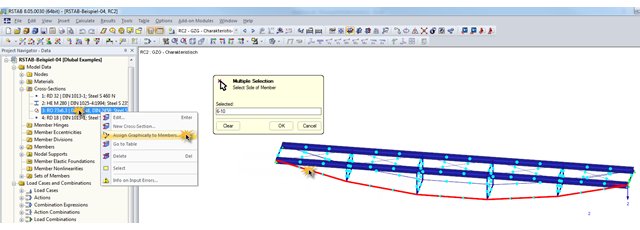
During the optimization of a structure, the individual cross‑sections may have to be modified several times. This can be done very quickly using the function "Assign Graphically to Members", which is available under "Cross‑Sections" in Project Navigator – Data.
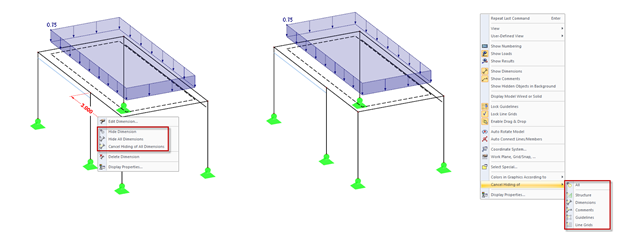
In addition to the options of Project Navigator - Display, you can modify the visibility of structures (members, surfaces, and so on) and guide objects (dimensions, comments, guidelines, and so on) in the menu and toolbar using the shortcut menus.
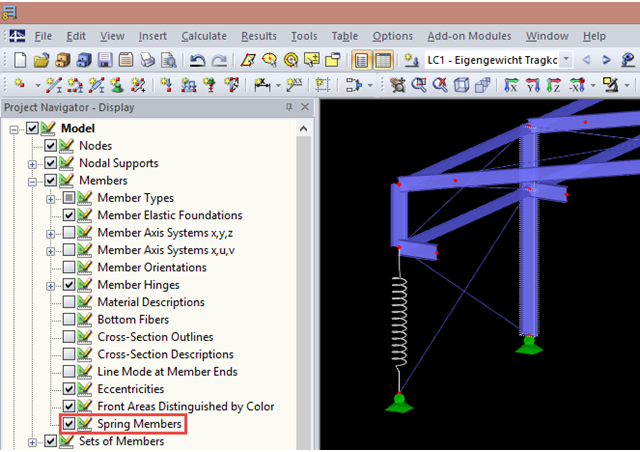
You can display spring members in the Display Navigator. A spring member is displayed as a helix by default. Clear the "Spring Members" check box to display them as normal lines.
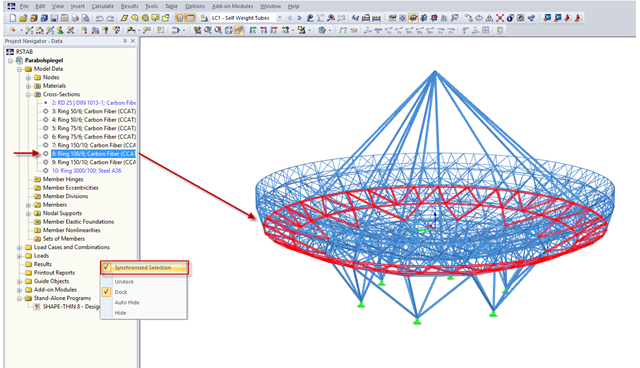
Users of RFEM and RSTAB already know the advantages of various visibilities that can be used to create user‑defined areas of the structure for further editing.
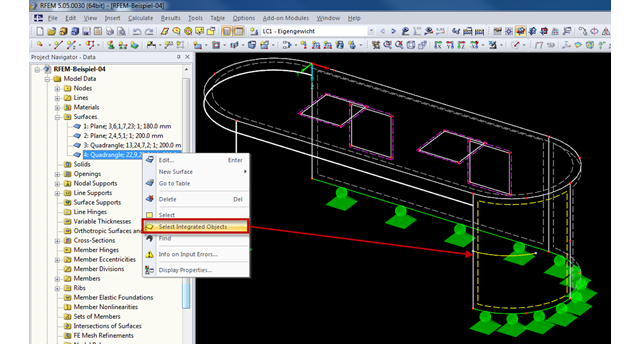
Generally, RFEM automatically detects all objects lying on a surface that are not used for surface definition. Objects integrated into surfaces can be selected using the "Select Integrated Objects" option in the shortcut menu of the relevant surface in Project Navigator. This way, you can easily find in the graphics which objects have already been integrated into a surface, for example.
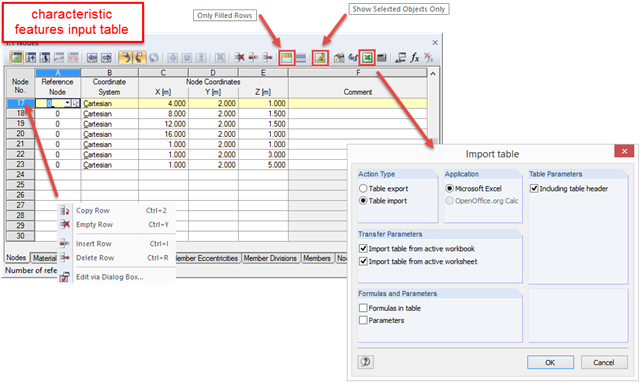
RFEM and RSTAB are programs where graphical input prevails. All data can be entered using dialog boxes, and the structure of the Project Navigator is optimized for input using the mouse. Nevertheless, you can always speed up the tabular input to reach your goal immediately.
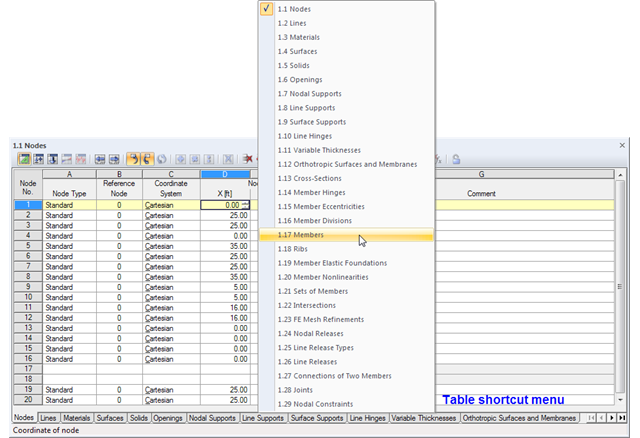
The geometry data of an RFEM model are currently managed in 29 tables, so not all of the tabs are displayed at once. To open a particular table, we recommend using the navigation menu that you can open by right-clicking on any tab. A shortcut menu appears, where you can quickly access the desired input table.
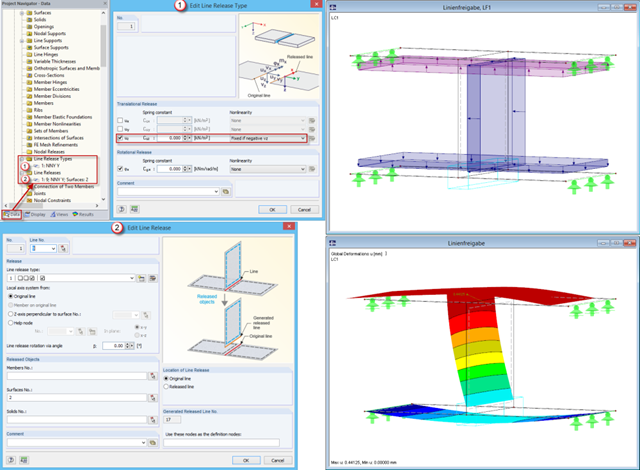
With version 5.05.0018, line releases are available in RFEM. You can access this new option in the Data Navigator.
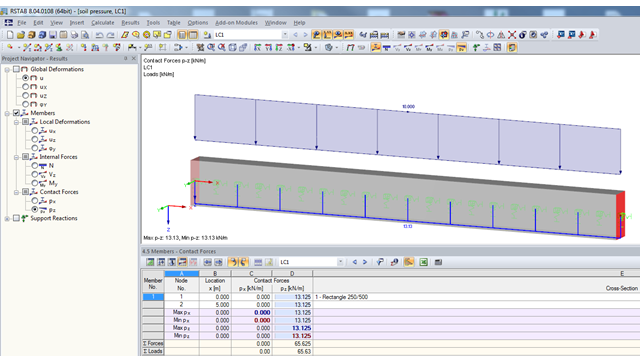
If a model should contain members with elastic foundations, the contact forces and moments are displayed in numerical form in the result windows. The graphical display of results is specified by the "Members" entry in the Results Navigator.